Data, asking questions, and disaster (the Thiokol graph)

The following two graphs are well-known; I was talking about them in class today.  The Thiokol engineer’s ‘chart” was unreadable, and so symptomatic of a culture of not really asking questions that challenged higher-ups.

32803-o-ring_damage-history_morton-thiokol


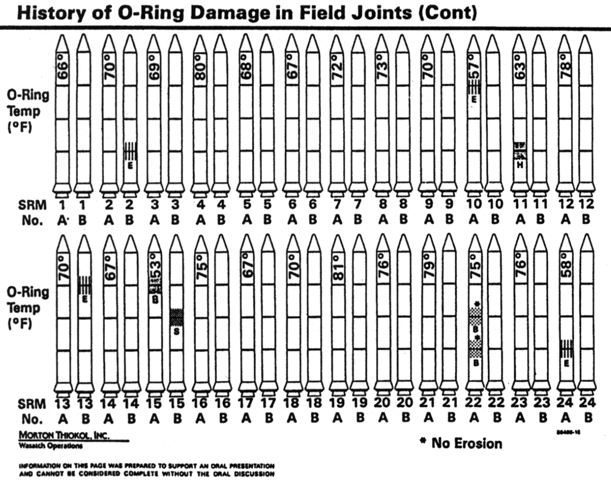
Here is a version of graph (there are now many) that might have stopped the launch.

challenger-disaster

About mkevane

Economist at Santa Clara University and Director of Friends of African Village Libraries.
This entry was posted in Teaching international trade, Teaching macroeconomics. Bookmark the permalink.